Crypto Chart Patterns – A Comprehensive Guide to Understanding and Utilizing Technical Analysis Techniques for Cryptocurrency Trading Success
In the ever-evolving world of digital currency, navigating the complex web of price movements and market trends can often feel like exploring a hidden treasure trove of possibilities. As experienced traders know, each cryptocurrency market is a living canvas, painted with a unique assortment of patterns that hold the key to unlocking profitable opportunities.
But just like any great masterpiece, these patterns cannot be taken at face value. They require a discerning eye, an understanding of market psychology, and a knack for recognizing the subtle nuances that separate mere fluctuations from potential breakthroughs.
So, dear cryptocurrency enthusiasts and aspiring traders, prepare to embark on a journey of exploration and discovery as we delve into the art of deciphering the secret language of cryptocurrency chart patterns. Through this comprehensive exploration, we will unravel the hidden meanings behind these intricate designs, empowering you to navigate the often turbulent waters of the crypto market with confidence and finesse.
Understanding the Basics of Crypto Chart Patterns
In this section, we will delve into the fundamental concepts behind the patterns that emerge in cryptocurrency price charts. By gaining a solid understanding of these patterns, traders can enhance their ability to predict future price movements and make informed trading decisions.
Analyzing Price Action
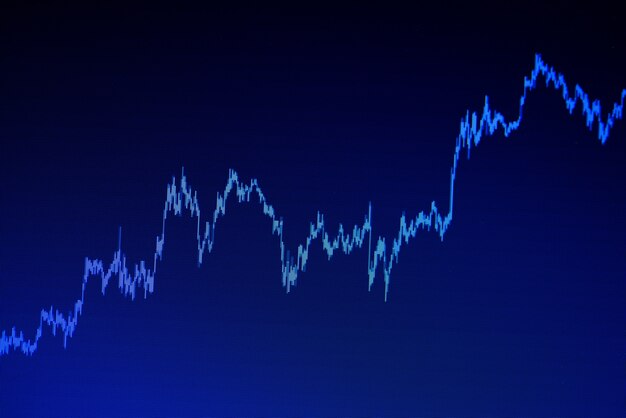
To comprehend crypto chart patterns, it is essential to closely examine price action. Price action refers to the movement of a cryptocurrency’s price over a given period of time. By scrutinizing price action, traders can identify patterns and trends that may indicate the future direction of the market.
Identifying Common Patterns
Within crypto chart patterns, there are recurring shapes and formations that occur. By learning to recognize and interpret these patterns, traders can gain insight into potential market reversals or continuations. Some common patterns include triangles, head and shoulders, double tops, and ascending or descending wedges.
By familiarizing themselves with the characteristics and implications of each pattern, traders can make more informed decisions in response to market movements. It is important to analyze patterns in conjunction with other technical indicators and market factors to increase the accuracy of predictions.
Overall, understanding the basics of crypto chart patterns provides traders with a valuable tool for navigating the volatile cryptocurrency market. By honing their skills in pattern recognition and analysis, traders can increase their chances of achieving consistent profitability.
The Importance of Identifying Chart Patterns in Crypto Trading
The significance of recognizing chart patterns in cryptocurrency trading cannot be overstated. These visual representations of price movements contain valuable information that traders can utilize to make informed decisions. By identifying patterns, traders can gain insights into future market trends and potential price reversals.
Recognizing patterns in crypto charts allows traders to anticipate possible price movements and plan their trading strategies accordingly. Patterns such as triangles, head and shoulders, double bottoms, and flags can indicate trend continuation or reversal. This information is crucial for traders looking to maximize their profits and minimize risks.
Moreover, identifying chart patterns helps traders spot potential entry and exit points. For example, breakout patterns can signal an opportune moment to enter a trade, while reversal patterns can indicate when it is time to exit a position. By understanding these patterns, traders can improve their timing and achieve better results.
In addition to entry and exit points, chart patterns can also provide insights into price targets. Some patterns have well-defined targets that traders can use to set their profit targets or stop-loss levels. This knowledge allows traders to set realistic expectations and manage their risk effectively.
It is important to note that chart patterns should not be used in isolation but in conjunction with other technical analysis tools and indicators. By combining pattern recognition with indicators like moving averages, oscillators, and volume analysis, traders can strengthen their analysis and make more accurate predictions.
In conclusion, identifying chart patterns is a crucial skill for crypto traders. Whether recognizing patterns for trend identification, entry and exit points, or price targets, these patterns offer valuable insights that can enhance trading strategies and decision-making. To excel in the volatile world of cryptocurrency trading, it is imperative to master the art of chart pattern recognition.
Common Crypto Chart Patterns and Their Significance
In this section, we will delve into the various recurring patterns that can be observed in cryptocurrency charts and explore their importance for traders. These patterns emerge as a result of the ever-changing market conditions, providing valuable insights into the future price movements of cryptocurrencies. By understanding the significance of these patterns, traders can make informed decisions and improve their chances of success in the volatile crypto market.
Identifying Patterns through Technical Analysis
Technical analysis is a fundamental tool used by traders to identify and interpret patterns in price charts. By analyzing historical price data, traders can spot common patterns that indicate potential future price movements. These patterns can range from simple formations like triangles and rectangles to more complex structures such as head and shoulders, double tops, and pennants. Understanding the significance of these patterns can help traders anticipate market trends and make informed trading decisions.
The Significance of Crypto Chart Patterns
The significance of crypto chart patterns lies in their ability to provide valuable information about a cryptocurrency’s price behavior. By recognizing these patterns, traders can gain insights into the supply and demand dynamics, market sentiment, and potential price reversals. These patterns can act as reliable indicators to determine optimal entry and exit points for trading positions. Furthermore, chart patterns are often accompanied by specific price movement and volume patterns, further reinforcing their significance in analyzing cryptocurrency markets.
In conclusion, recognizing and understanding common crypto chart patterns is crucial for traders who wish to navigate the volatile cryptocurrency market successfully. By utilizing technical analysis and being aware of the significance of these patterns, traders can enhance their trading strategies and increase their chances of making profitable trades.
Using Chart Patterns to Make Educated Trading Decisions
Chart patterns have become a valuable tool in the world of cryptocurrency trading. By analyzing these patterns, traders can gain insights into market trends and make informed decisions about when to buy or sell. Understanding how to interpret these patterns can provide a competitive edge in a volatile market.
One of the key benefits of utilizing chart patterns is the ability to identify potential price reversals. By recognizing patterns such as head and shoulders, double tops, or triangles, traders can anticipate when a trend may be ending and a new one is about to begin. This knowledge allows them to enter or exit positions at advantageous times, maximizing profit potential.
- Head and Shoulders Pattern: This pattern is characterized by a peak (head), followed by two smaller peaks (shoulders) on either side. It usually indicates a trend reversal from bullish to bearish.
- Double Tops Pattern: A double top pattern occurs when the price reaches a high point, retraces, and then fails to break the previous high. This pattern suggests a potential trend reversal from bullish to bearish.
- Triangles Pattern: Triangles are formed by connecting the highs and lows of price action. They can be ascending, descending, or symmetrical. Triangles often precede significant breakouts in either direction.
It is important to note that these chart patterns should not be relied upon as standalone indicators. Traders should incorporate other technical analysis tools, such as trend lines, moving averages, and volume indicators, to validate their observations and confirm potential trading opportunities.
Furthermore, it is crucial to keep in mind that chart patterns are not foolproof and can sometimes produce false signals. Traders should always apply risk management strategies, such as setting stop-loss orders and diversifying their portfolios, to mitigate potential losses.
In conclusion, being able to identify and interpret chart patterns can significantly enhance a trader’s ability to make educated trading decisions in the cryptocurrency market. By utilizing these patterns alongside other technical analysis tools and employing effective risk management strategies, traders can increase their chances of success and navigate the volatile nature of the market with confidence.
Advanced Strategies for Analyzing and Trading Crypto Chart Patterns
In this section, we will explore advanced techniques and tactics for effectively analyzing and trading various patterns found in cryptocurrency charts. By employing these strategies, traders can enhance their understanding of market trends and increase their chances of making profitable trades.
Understanding the intricacies of crypto chart patterns is essential for traders looking to maximize their profits. By employing advanced analytical tools and methodologies, such as Fibonacci retracements and trendline analysis, traders can gain deeper insights into market behavior and identify potential entry and exit points with higher precision.
Utilizing Fibonacci Retracements
Fibonacci retracements are a powerful tool for identifying potential support and resistance levels in cryptocurrency charts. By plotting these retracement levels based on the Fibonacci sequence, traders can pinpoint areas where price corrections may occur, allowing them to strategically plan their trades.
By combining Fibonacci retracements with other chart patterns, such as the head and shoulders or double top formations, traders can create a comprehensive analysis of potential price movements. This allows them to make informed decisions about when to enter or exit trades, based on the likelihood of a price reversal or continuation.
Examining Trendline Analysis
Trendline analysis is another advanced technique used to identify and validate trends in crypto chart patterns. By drawing trendlines that connect multiple swing highs or swing lows, traders can gain insights into the direction and strength of a trend.
Moreover, using trendline analysis in conjunction with other technical indicators, such as moving averages or the Relative Strength Index (RSI), can provide confirmation signals and enhance the accuracy of trading decisions. This combination of tools empowers traders to ride trends and profit from potential breakouts or reversals.
By mastering these advanced strategies for analyzing and trading crypto chart patterns, traders can increase their profitability and stay ahead of the evolving cryptocurrency market. However, it is crucial to practice risk management and continuously adapt to market conditions to ensure long-term success.
Tools and Resources for Recognizing and Analyzing Crypto Chart Patterns
The field of cryptocurrency trading presents a multitude of opportunities for traders to capitalize on market trends and patterns. To effectively navigate this complex terrain, it is crucial for traders to have access to a variety of tools and resources for recognizing and analyzing crypto chart patterns. In this section, we will explore some essential tools and resources that can aid traders in their quest to identify and interpret these patterns.
1. Technical Analysis Software
Technical analysis software serves as a valuable resource for traders seeking to analyze crypto chart patterns. These tools offer a wide range of features, including charting capabilities, pattern recognition algorithms, and various indicators. By utilizing technical analysis software, traders can gain insights into historical price movements, identify recurring patterns, and make informed decisions based on data-driven analysis.
2. Online Communities and Forums
Engaging with online communities and forums dedicated to cryptocurrency trading provides traders with a platform to exchange knowledge, insights, and experiences related to chart pattern recognition. By participating in these communities, traders can access valuable information, engage in discussions, and learn from the experiences of other traders. This collaborative environment can provide new perspectives and help refine traders’ abilities to recognize and analyze chart patterns effectively.
| Tool/Resource | Description |
|---|---|
| TradingView | A popular online platform offering comprehensive charting and technical analysis tools for traders. |
| CoinMarketCap | A widely-used website providing real-time cryptocurrency market data and price charts for various cryptocurrencies. |
| Investopedia | An online resource offering educational content on various aspects of trading and investing, including chart pattern analysis. |
| Telegram groups | Various telegram groups dedicated to cryptocurrency trading, where traders can share insights and discuss chart patterns. |
These tools and resources are just a starting point, and traders are encouraged to explore and experiment with different options to find the combination that best suits their trading style and goals. By leveraging these tools and engaging with communities, traders can enhance their ability to recognize and analyze crypto chart patterns, ultimately improving their trading decisions and outcomes.
Questions and answers: Crypto chart patterns
What are crypto chart patterns and why are they important for traders?
Crypto chart patterns are specific formations that appear on price charts of cryptocurrencies and are used by traders to analyze market trends and make informed trading decisions. They are important because they provide valuable insights into the psychology of the market and help identify potential buying or selling opportunities.
How can crypto chart patterns help traders predict future price movements?
Crypto chart patterns help traders predict future price movements by indicating potential trend reversals, continuation patterns, and support/resistance levels. By recognizing these patterns, traders can anticipate the direction of the market and adjust their trading strategies accordingly.
Are there different types of crypto chart patterns?
Yes, there are various types of crypto chart patterns such as triangles, rectangles, head and shoulders, double tops/bottoms, and flags/pennants. Each pattern has its own characteristics and indicates different market conditions and potential outcomes.
Can beginners effectively use crypto chart patterns in their trading strategies?
Yes, beginners can effectively use crypto chart patterns in their trading strategies. However, it is essential for beginners to understand and learn how to identify and interpret these patterns correctly. Education, practice, and experience will help beginners gain proficiency in using chart patterns for trading decisions.
Are there any risks associated with relying solely on crypto chart patterns?
Relying solely on crypto chart patterns can involve certain risks. It is important to remember that chart patterns are not 100% accurate indicators of future price movements. Traders should consider other factors like market news, fundamental analysis, and risk management techniques to make well-informed trading decisions.
What are crypto chart patterns and why are they important for traders?
Crypto chart patterns are specific visual formations that appear on price charts and provide valuable information about the potential future direction of a cryptocurrency’s price. Traders use these patterns to make informed decisions about buying, selling, or holding their assets.
What is a flag pattern?
A flag pattern is a technical analysis chart pattern that represents a temporary consolidation or pause within a strong trend, typically resembling a rectangular-shaped flag.
How does a rising wedge pattern appear on a trading chart?
A rising wedge pattern appears when the price forms higher highs and higher lows, creating a narrowing range between two converging trendlines sloping upwards.
What defines an ascending triangle pattern in trading analysis?
An ascending triangle pattern is characterized by a horizontal upper trendline and a rising lower trendline, indicating a bullish continuation pattern.
When does a wedge pattern typically occur in trading?
A wedge pattern typically occurs when the price consolidates between converging trendlines, showing a narrowing range either upwards (rising wedge) or downwards (falling wedge).
How is a descending triangle pattern identified on a trading chart?
A descending triangle pattern is identified by a horizontal lower trendline and a declining upper trendline, suggesting a bearish continuation pattern.
Why is it important to read crypto trading volume when analyzing patterns?
Reading crypto trading volume is crucial because it helps confirm the validity of patterns and provides insights into market participation and potential price movements.
What are trading chart patterns and how do they influence crypto price analysis?
Trading chart patterns are visual representations of price movements on a trading chart, which traders analyze to identify potential trading opportunities based on historical price behavior.
What is the significance of bottom patterns in crypto trading?
Bottom patterns indicate potential reversal points in a downtrend, suggesting that selling pressure may be waning and buyers could take control, leading to a possible price increase.
How do bearish patterns work in crypto trading?
Bearish patterns indicate potential downtrends in the price of a cryptocurrency, signaling that selling pressure is likely to persist or increase, and traders may consider selling or shorting positions.
What is a bearish continuation pattern in trading analysis?
A bearish continuation pattern is a chart pattern that suggests the continuation of a prevailing downtrend, indicating that the selling pressure is likely to persist following a temporary consolidation phase.
How do you read crypto charts to identify trading opportunities?
To read crypto charts effectively, traders analyze price movements and various technical indicators to make informed decisions about buying or selling cryptocurrencies.
When does a double bottom pattern appear on a crypto chart?
A double bottom pattern appears when the price forms two distinct troughs at approximately the same level, signaling a potential reversal of a downtrend.
How can traders use the cup and handle pattern in crypto trading?
Traders can use the cup and handle pattern to identify potential buying opportunities, as it indicates a bullish continuation pattern after a period of consolidation.
What is the handle pattern in the context of chart analysis?
The handle pattern is a small consolidation or retracement that follows the cup formation in the cup and handle pattern, typically forming a downward sloping trendline.
Which chart pattern is characterized by a series of peaks, followed by a higher peak in the middle?
The head and shoulders chart pattern is characterized by three peaks, with the middle peak (head) being higher than the other two (shoulders), indicating a potential trend reversal.
When does a rectangle chart pattern typically occur on a crypto chart?
A rectangle chart pattern typically occurs when the price moves within a horizontal range bounded by parallel support and resistance levels, suggesting a period of consolidation.
How do traders predict a crypto pump using chart patterns?
Traders may predict a crypto pump by identifying bullish chart patterns, such as ascending triangles or cup and handle patterns, which suggest potential upward price movements.
What are some common chart patterns used in crypto trading?
Common chart patterns used in crypto trading include head and shoulders, double top and bottom, triangles (ascending, descending, and symmetrical), flags, and pennants.
Why are top and bottom patterns often considered significant in crypto trading?
Top and bottom patterns are often considered significant because they indicate potential reversal points in price trends, providing opportunities for traders to enter or exit positions.
How do traders use a neutral chart formation to make trading decisions?
Traders may use a neutral chart formation, such as a sideways trading range or a rectangle pattern, to implement range-bound trading strategies, buying near support levels and selling near resistance levels.

No responses yet